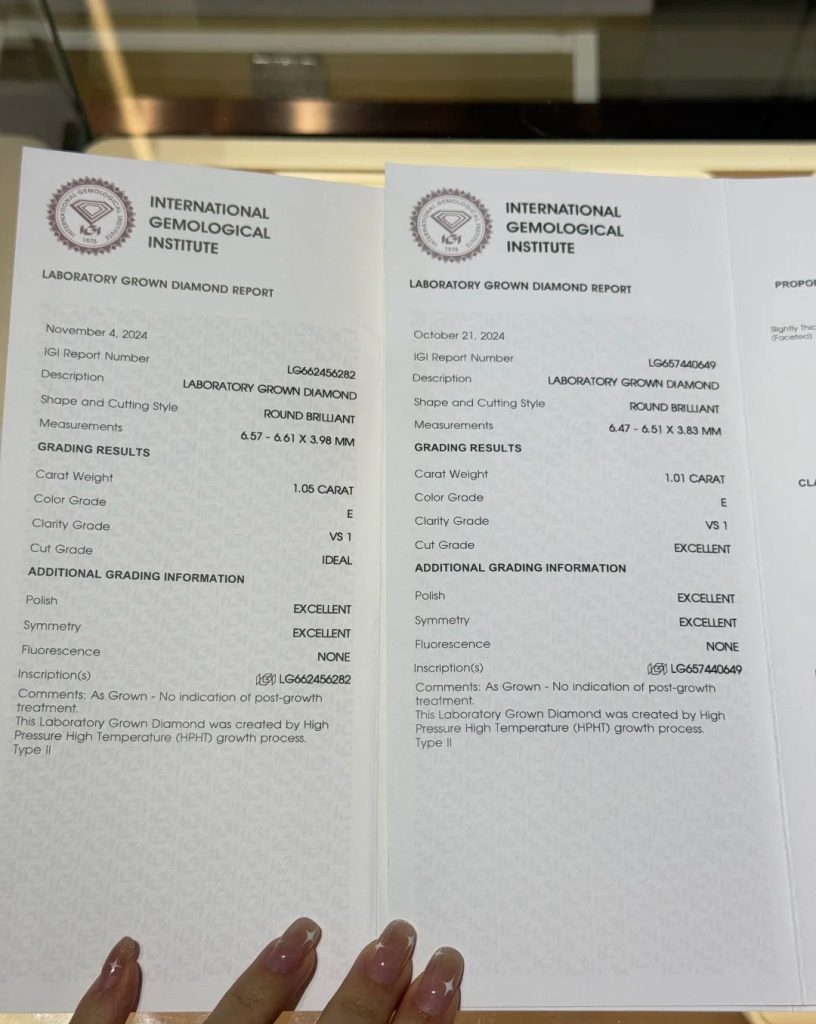
I recently compared two IGI lab-grown diamonds that look almost identical on paper:
Both are:
• ~1 carat
• E color
• VS1 clarity
• Excellent / Ideal cut grades
• Excellent polish & symmetry
But when I analyzed the reports using my IGI Report Checker, the results were very different.
🎥 Diamond Comparison Video (Left vs Right)
In the video you can see the real visual performance difference between the two stones.
Diamond on the Left
Score: 85.29 / 100
Ranking: 👍 Good (could have been Excellent if it’s more recent)
Key proportions:
• Table: 58%
• Crown angle: 34.4°
• Pavilion angle: 40.6°
• Total depth: 60.5%
These proportions fall close to ranges associated with strong light performance and brilliance.
Diamond on the Right
Score: 58.82 / 100
Ranking: ❗ Needs Further Consideration
Key proportions:
• Table: 63%
• Crown angle: 33.7°
• Pavilion angle: 40.2°
• Pavilion depth: 42%
These values move away from optimal ranges, which can reduce light return and fire.
🔎 Try the checker yourself
You can verify the analysis by entering the IGI report numbers:
LG662456282
LG657440649
The checker only needs the IGI report number to run the analysis.
Compare the scores with the video and see how the report proportions translate into real visual performance.
💡 This is exactly why I built the IGI Report Checker.
It helps you:
• Analyze the proportions inside an IGI report
• Estimate a diamond’s potential brilliance
• Identify stronger diamonds before seeing them in person
• Avoid paying for a stone that looks good on paper but performs poorly
Sometimes two diamonds with similar grades can perform very differently in real life.
This tool helps you spot that difference before you buy.